
2024 Price-to-Earnings Premium
Interactive Results
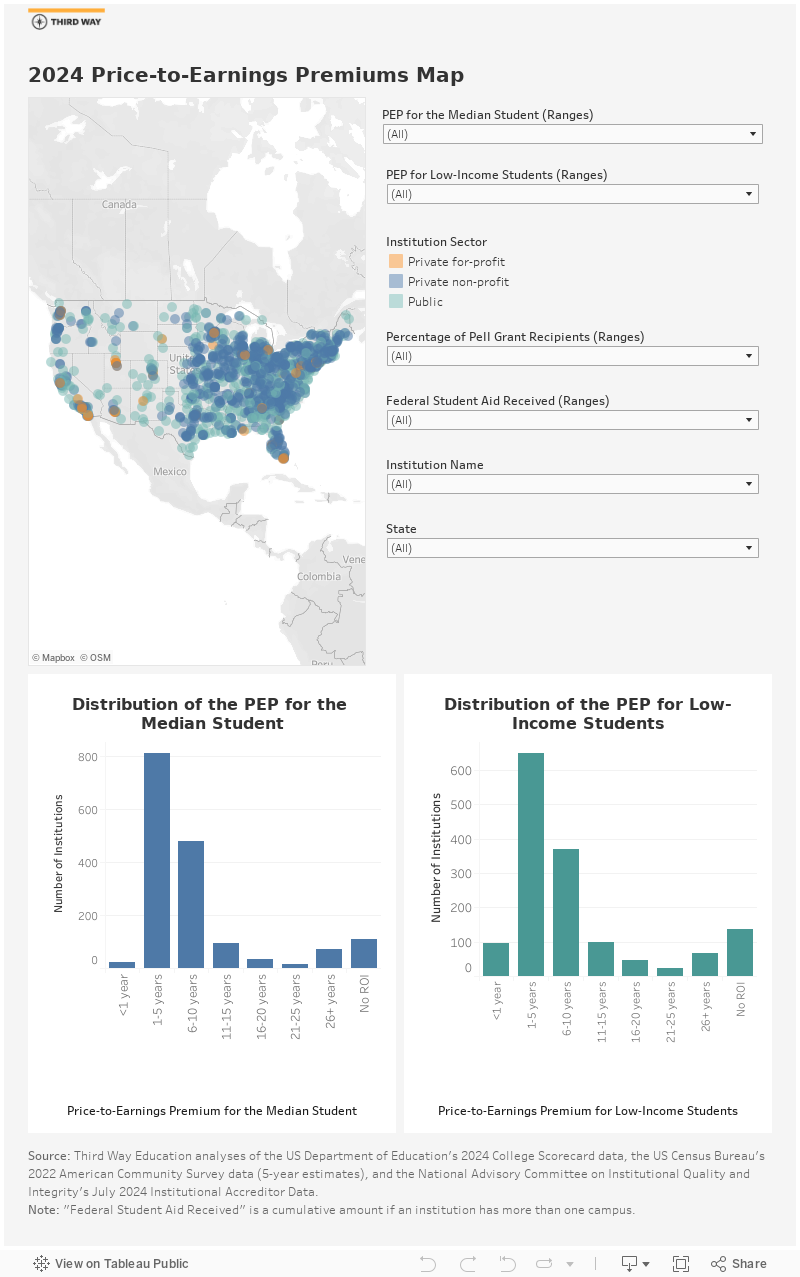
This interactive map shows the PEP and low-income PEP values for institutions across the United States. You can set the criteria you’re interested in exploring, including predominant degree type, institutional sector, and state. The longer it takes a student to receive a return on their investment, the higher the PEP value. If you can’t see the low-income PEP, there was not enough data to calculate it.
2024 Price-to-Earnings Premium
Explore the results of the 2024 Price-to-Earnings Premium through this interactive map.
Related Posts
Price-to-Earnings Premium Archive
-
2023 Price-to-Earnings Premium
 Archive
 -
2021 Price-to-Earnings Premium
 Archive
View More +
LEARN MORE
Economic Mobility Index
Explore our Economic Mobility Index data set.